
Moving Average Plot

Moving Average Plot
$100.00
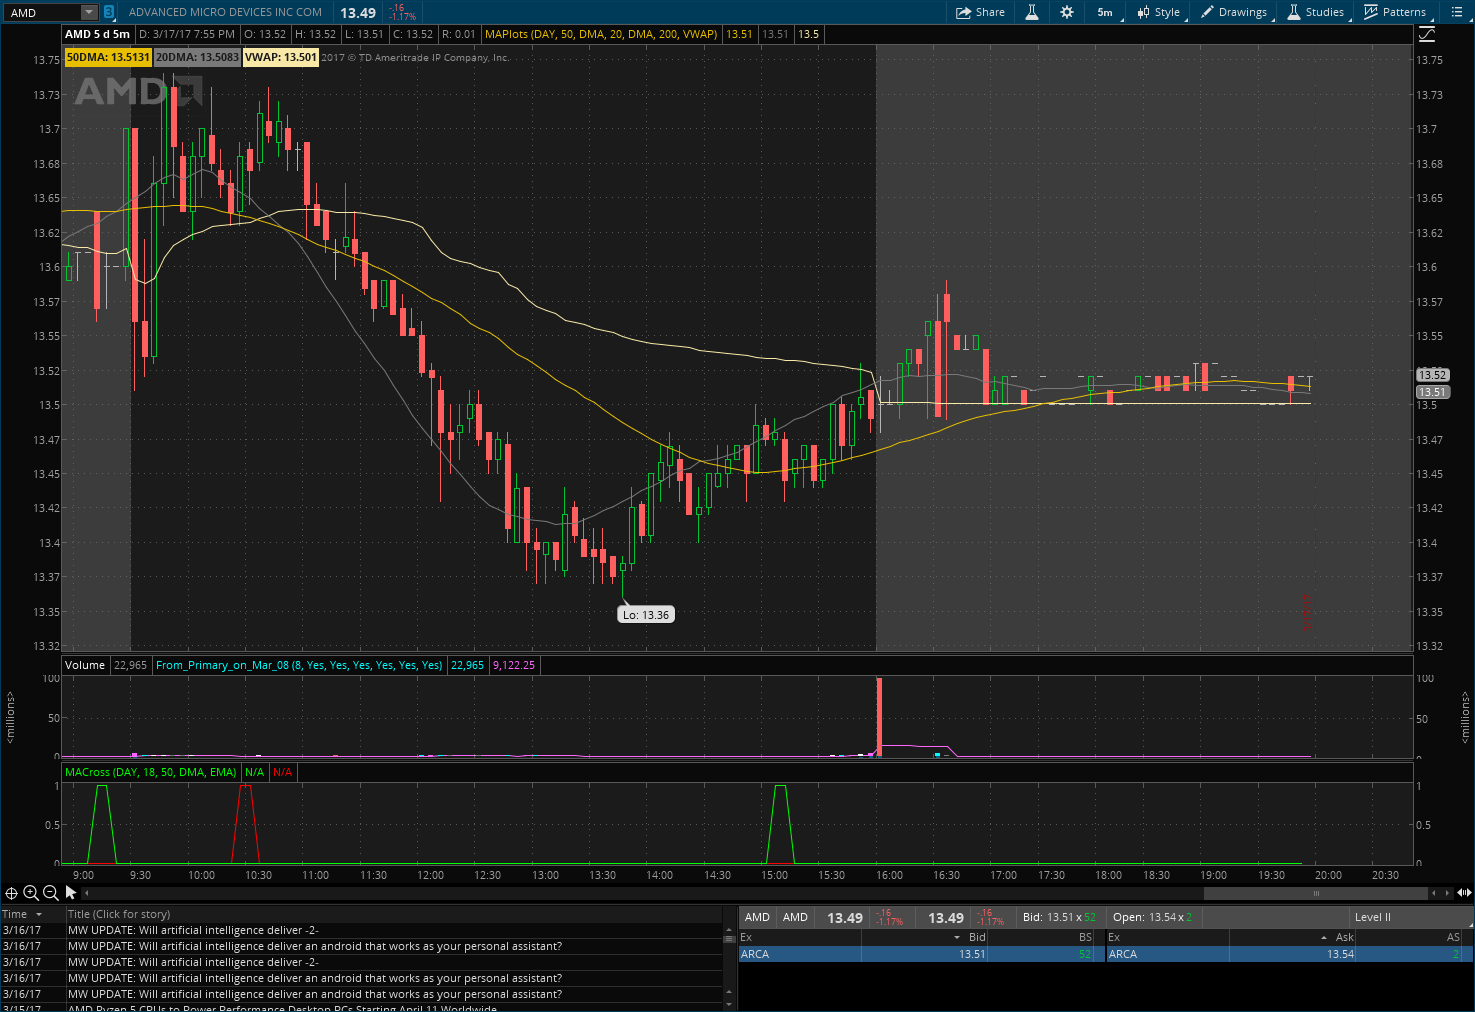
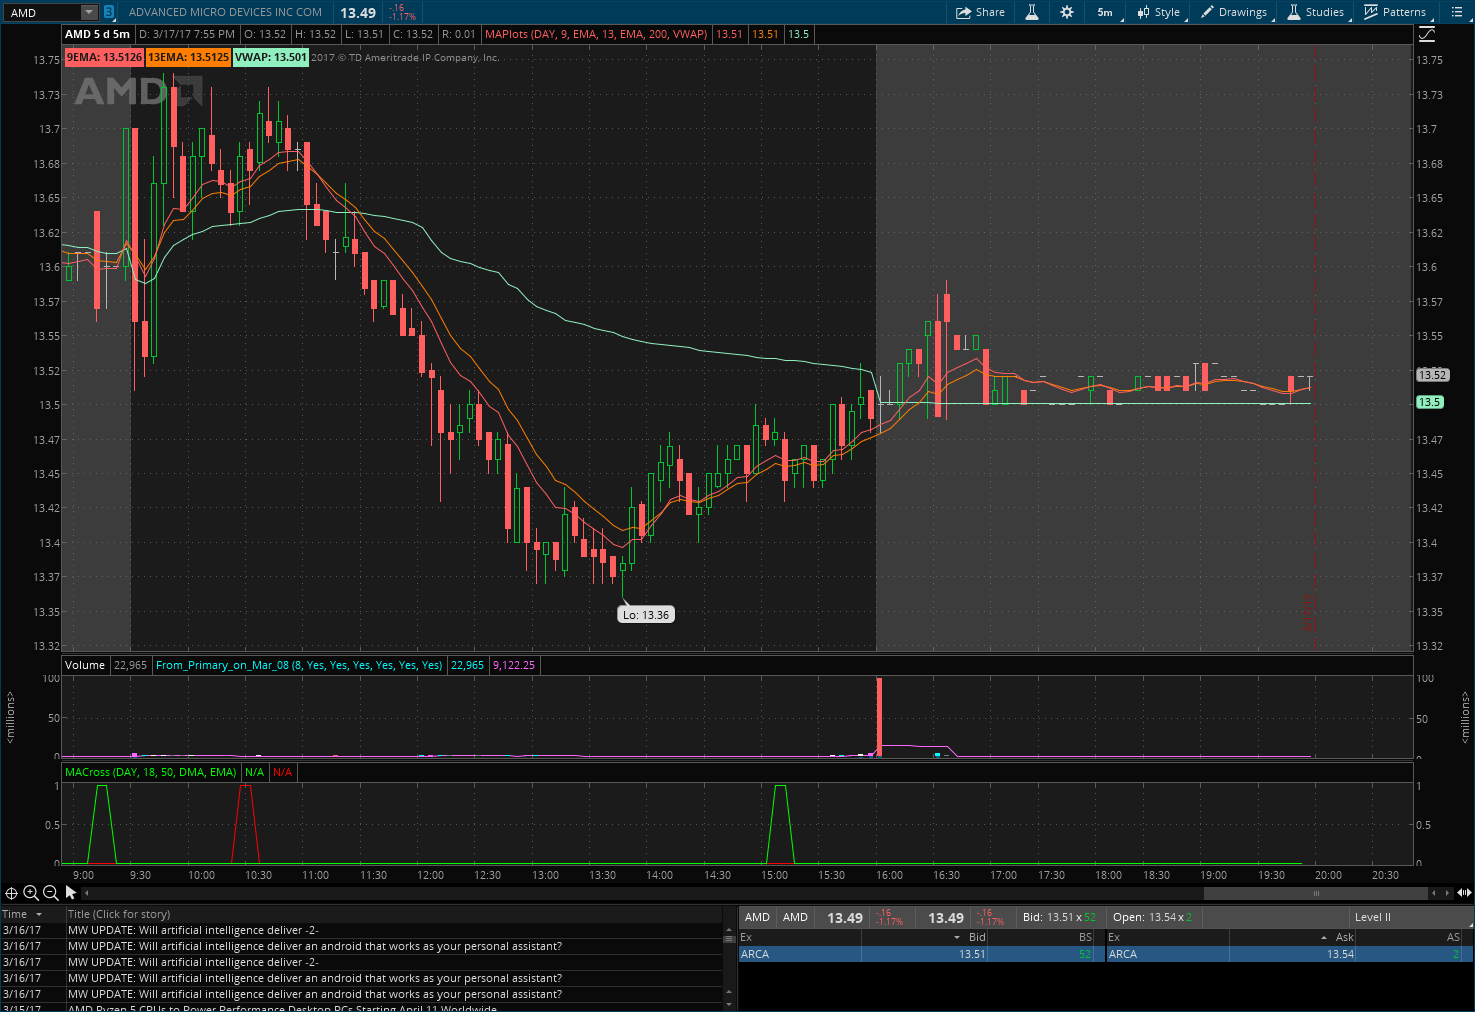
This script is for plotting moving average lines. It lets you pick any 3 periods, and any 3 moving averages and displays the lines on the chart for you. It will also add a label at the top of the chart that will always match the color of the plot line. If you want to hide the plot line but keep the label, you can do so. Includes SMA, EMA, DMA, WMA, and VWAP over any period.